Web analytics for an online store: what indicators to measure?

The use of web analytics metrics for an online store is often underestimated, but it is an important tool to increase sales and revenue.
Creating an effective commercial website consists of many elements. The choice of hosting, domain, optimization of product cards and price offer are undoubtedly key factors. However, with all this, we should not forget about web analytics for an online store. This information helps to draw conclusions that go beyond the number of goods sold. In this article, you'll learn what metrics you should measure to conduct effective web analytics.
Why is web analytics so important?
The e-commerce industry would not have achieved such development without web analytics. It is this element that gives the online store (which uses Internet marketing) the main advantage over traditional stores and so-called traditional forms of marketing.
Measuring specific metrics and checking store statistics helps you make more informed business decisions, identify the sources of problems, and accurately calculate the ROI of the actions you take.
Choosing the Right Tools for Ecommerce Analytics
In recent years, many software tools for web analytics of online stores, both free and paid, have appeared on the market.
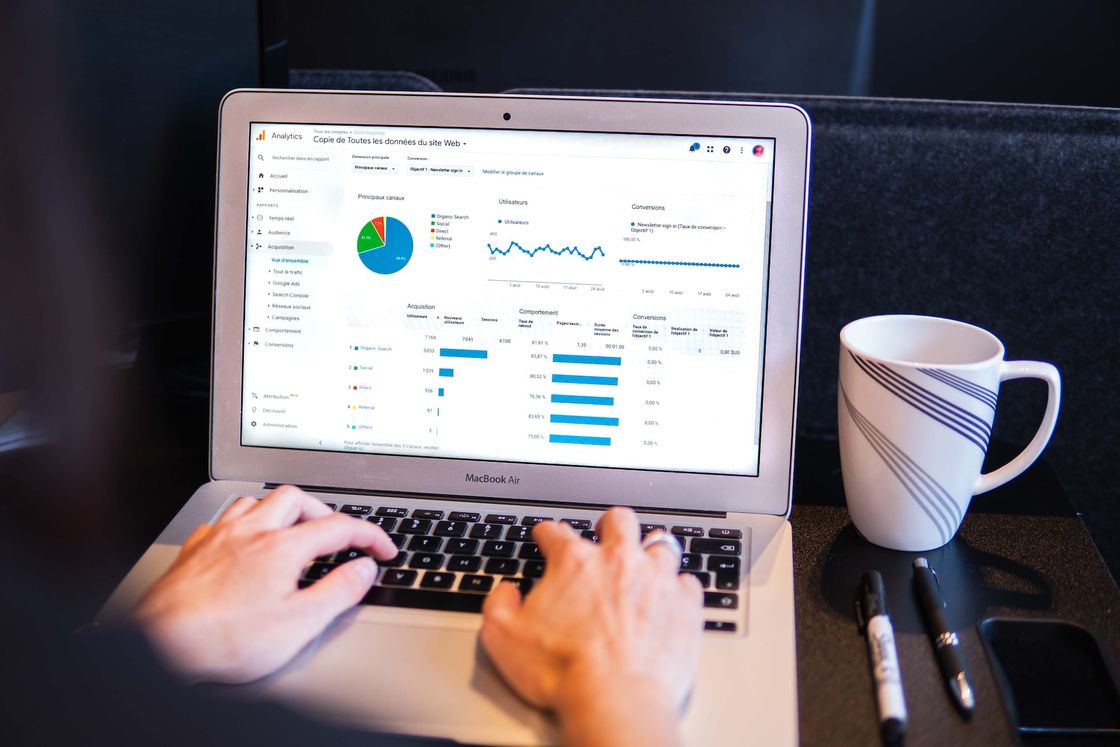
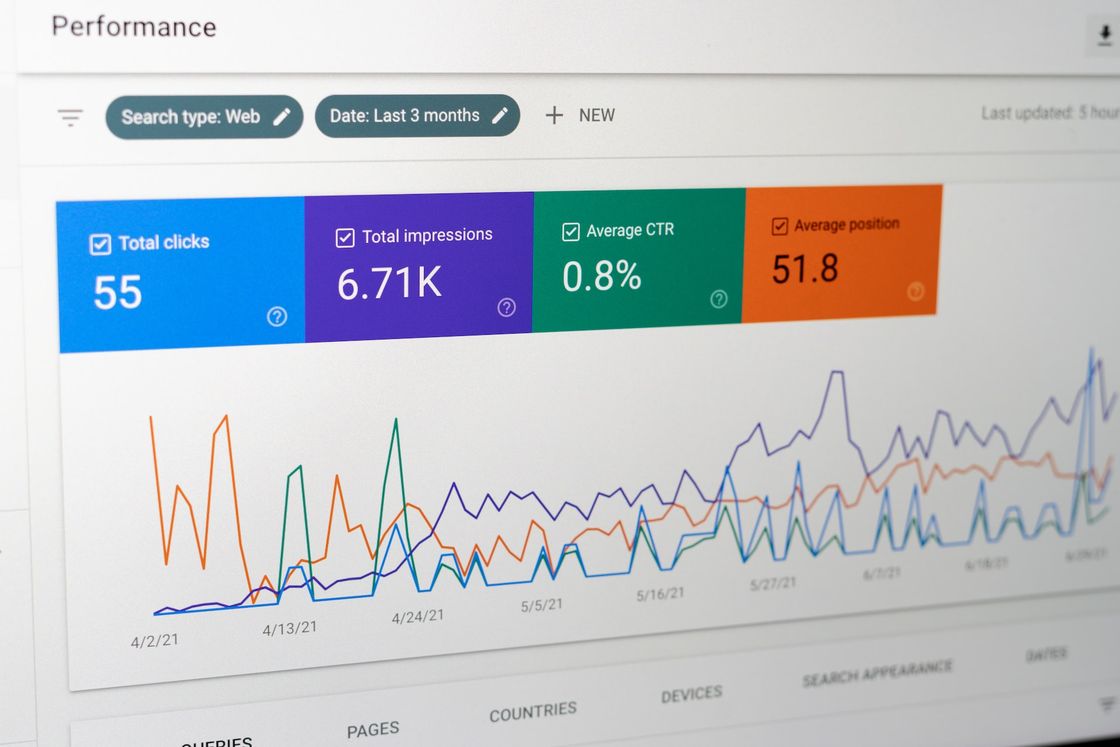
In the first case, Google Analytics is the undisputed leader. GA is a very extensive and constantly evolving tool. It gives you access to a huge amount of data that can be used in an online store to improve sales or UX. This is a rational choice for all companies wishing to get as much statistical data as possible about the store, users and their behavior.
For social media companies, Facebook Analytics will prove to be a useful tool. It allows, for example, to check visits to the site from Facebook, as well as to gain access to detailed statistics on the effectiveness of sales when conducting paid actions in social networks (campaigns to increase attendance or remarketing).
The symbiosis of both Google and Facebook Analytics solutions works best. Their use leads to more accurate and reliable data, which gives the widest opportunities in terms of web analytics.
Checking Internet statistics is also possible with the help of built-in analytical tools CMS or plugins that extend the functionality of these systems. However, they are not as effective and do not provide access to as much information as Google or Facebook in the free version.
The most important indicators of web analytics
Let's look at the specific indicators that an online store needs to track.
Checking site traffic
Traffic is the basis of an online store. Without it, there is no sale, and vice versa. However, the statistics of site visits without a broader context will not give you anything. So what to combine them with? First of all, it is worth regularly checking the source of traffic on the site. Do visitors appear due to the good positioning of the site in organic results, PPC advertising or maybe they come from social networks?
Knowing where the traffic to the online store comes from, you will be able to determine in which ways of promotion you should invest. More advanced web analytics will also measure conversions based on the marketing channel used. However, these are only basic statistics, and not what you are most interested in, that is, the effectiveness of sales.

Conversions, i.e. the relationship between traffic and sales
Traffic needs to be considered in the context of sales. The fact that an online store has high traffic does not mean that revenue will be satisfactory. Therefore, you should regularly check the website statistics and compare how new users affect the actual revenue of the company. How do I do this?
This is where a set of several conversion analytics metrics comes to the rescue. First of all, the online store owner needs to know the conversion rate, that is, what percentage of website visits translate into sales. The higher the conversion, the more successful the store. Then the key to success is simply to increase quality traffic.
When the conversion rate is low with high store traffic, the mistake may be in a poorly optimized sales path or in an offer that is not adapted to the target group. Maybe your online campaign is reaching the wrong people it should reach? Conversion analytics gives a clear signal for improvement, especially when the number of transactions is clearly decreasing and traffic on the website is not increasing.
Track abandoned carts
This is a very important point in web analytics. It does not happen that every transition to the cart ends with a purchase. Sometimes users come to this point to see what the payment methods are or the final cost of shipping an item.
What conclusions can be drawn from the percentage of abandoned carts? For example, if 95% of the transition to viewing purchases ends in rejection, this may be a sign that, for example, the shipping cost is too high or the payment methods you offer do not satisfy a significant portion of customers.
Set up conversion rate and costs
These are critical elements of web analytics. To properly measure sales, you must first establish in the chosen tool what is a confirmation of sales for you. Most often it is a page with gratitude after paying for the order. This configuration of the tool provides an additional field for viewing sales statistics.
In terms of sales, some subpages matter more than others, such as going to the shopping cart or subscribing to a newsletter. They clearly demonstrate the buyer's interest in your store and its offer. That is why it is recommended to separately take into account the transitions to certain subpages. It also allows you to check which pages users are visiting and whether they are useful to you.
In addition, individual products in Google Analytics must be assigned certain values. Thanks to this, you will get access to an additional panel that shows the profits from certain products. To make it easier to check site statistics and sales profitability, you can also set a markup amount for a specific product and see profits without deducting taxes.
Lifetime Customer Value (LTV)
The lifetime value of the client determines how much profit the online store will receive from one client for the entire period during which he buys from you.
For example, if the average customer buys from you 3 times and spends an average of 1000 rubles at a time, his LTV is 3000 rubles. This is an extremely important internet statistic, as LTV directly indicates the profitability of the store. A company with a high LTV score will be able to allow more investment in marketing, since each attracted client will be associated with high long-term profits.
Site traffic by returning visitors
Another important statistic in terms of web analytics. This is the percentage of users who return to the site after the first visit. The high value of this indicator also indicates that visitors liked the store and its offer.
Some industry experts estimate that the visitor return rate should be over 20%. But it largely depends on the specifics of the industry and your customers.
Web analytics of time spent on the site
Online store analytics should also include the average amount of time users spend in a store per visit. The value of this indicator will largely depend on the specific product that you are selling.
If it is, for example, expensive electronic equipment, the choice of which takes much longer when comparing different offers, the average time on the store's website will be higher. In any case, a relatively high value of this indicator may indicate a good user experience of an online store and the correct choice of the target audience.
Statistics of visits and number of pages visited
This web analytics metric is the average number of pages that users navigate to in a single visit. A high value of the indicator may indicate that visitors are interested in the product being sold.
On the other hand, this may mean that finding the right product in the store is too complicated and requires viewing several subpages of the site.

Bounce rate
Web analytics in an online store will allow you to take a closer look at another element. Bounce rate shows how many people don't open any other pages after visiting a store. This means that they "bounce" off the first page.
A high bounce rate may indicate:
- poor user experience;
- slow page loading speed;
- positioning by inappropriate keyword phrases;
- inconsistency of the proposal with the target group;
Conversion rate and devices
Pay special attention to the differences in conversions depending on the devices that customers are using. It may turn out that, for example, the mobile version of an online store needs serious improvements in order to bring more profit. If today most transactions occur from stationary devices, this is a serious reason to think about improving the mobile version of the site.
Geographical location of visitors
When scanning traffic on your site, it is recommended to use geographic filters.
This will help you figure out which cities or regions (and even countries if you're selling overseas) generate the most sales. Such data will help to establish more accurate targeting of promotion depending on the location of buyers.
You can use geographic information to find out why certain regions have fewer sales, and then target them with specifically planned promotional activities.
Web Analytics for an Online Store: Conclusions
Of course, web analytics in the field of e-commerce involves the measurement of many other statistical data, but we have listed a set of basic indicators that need to be paid special attention to. Web analytics are often underestimated, and yet, insights from statistics can directly impact revenue growth.
Do not neglect this element - learn to regularly receive the most important information from it and translate the knowledge gained into sales of an online store.
Previous Article
Creating a page with prices: psychology pricing pageNext Article
The 14 Best Sites to Create a Free Blog